
A house inflation calculator provides a way to determine how the value of a house has changed over time due to inflation and other factors. Such calculators can be essential tools for homeowners, potential buyers, and investors to understand the real value and appreciation of a property. You can calculate property inflation for the USA, Canada, Australia, Ireland, India, UK, and other regions.
How to Calculate House Inflation Rate?
- Input Initial House Value: Enter the price of the house when it was first bought or its initial valuation.
- Input Years Passed: Specify the number of years since the initial valuation.
- Input Average Annual Inflation Rate: Enter the estimated average yearly inflation rate (as a percentage) for the time period in question.
- Click on “Calculate”: The tool will display the adjusted house value after accounting for the specified inflation rate over the given number of years.
Remember, the actual value of a house can be influenced by many factors beyond inflation, such as the local real estate market, renovations, and more. This tool provides a simplified measure, focusing only on inflation’s impact.
House Inflation Calculator
Understanding the Inflation Calculation
Let’s break down the formula step by step:
- Initial House Value (
initialValue): This is the starting value or the price of the house when it was first bought or valued. - Years Passed (
years): This represents how many years have elapsed since the initial valuation. - Average Annual Inflation Rate (
inflationRate): This is the yearly average rate at which the value of the house increases due to inflation.
Formula to Calculate Adjusted House Value
The adjusted house value after taking inflation into account is given by the formula:
Adjusted Value=Initial Value×(1+Inflation Rate)Years
Adjusted Value=Initial Value×(1+Inflation Rate)Years
Where:
- Adjusted Value: Adjusted Value is the value of the house after factoring in the inflation.
- Initial Value: Initial Value is the starting value or the price of the house when it was first bought or valued.
- Inflation Rate: The inflation Rate is the yearly average rate of inflation (expressed as a decimal, i.e., 5% becomes 0.05).
- Years: Years is the number of years that have passed.
Explanation with an Example
Let’s say you bought a house 5 years ago for $200,000. If the average annual inflation rate over these years was 3%, how much would the house be worth now in adjusted dollars?
Using the formula:
Adjusted Value=200,000×(1+0.03)5
Adjusted Value=200,000×(1+0.03)5
Adjusted Value=200,000×(1.03)5
Adjusted Value=200,000×(1.03)5
Adjusted Value≈200,000×1.1593
Adjusted Value≈200,000×1.1593
\text{Adjusted Value} \approx $231,860
So, after 5 years with a 3% annual inflation rate, the house’s adjusted value would be approximately $231,860.
However, keep in mind:
- Regional Factors: Different areas might experience different rates of housing inflation based on supply and demand, local economic conditions, and other factors. National averages might not be reflective of specific regions or neighborhoods.
- Limitations: This simple model doesn’t account for factors like renovations, local market crashes, or specific events that can greatly affect home value.
- Data Sources: Reliable data on annual housing inflation rates is essential for accuracy. This can be sourced from national housing agencies, real estate indices, or other financial institutions.

To turn this into a digital tool:
- User Interface: Design a simple form where users can input the Starting Value, Years Passed, and select or input an Annual Inflation Rate.
- Calculation Script: Use a scripting language (like JavaScript for a web-based tool) to apply the formula and display the adjusted value.
- Database (optional): If you want to provide users with regional inflation rates, store this data in a database and fetch it when required. This can also allow users to see historical rates and make projections based on different rates.
Many existing online calculators and real estate websites may offer similar tools, but having a customized tool can be beneficial if you want to focus on specific regions, data sources, or additional factors.
Housing Inflation Rate
The housing inflation rate, also referred to as the house price inflation rate, reflects the annual percentage change in house prices. This rate can give insights into how quickly the value of homes is increasing or decreasing in a particular region or country. Several factors can influence the housing inflation rate:
- Supply and Demand: A basic economic principle where increased demand and limited supply can drive up prices, and vice versa.
- Interest Rates: Generally, lower interest rates can lead to increased borrowing, which can boost demand for homes and subsequently increase prices.
- Economic Growth: A strong economy with rising incomes can result in increased demand for homes.
- Government Policies: Tax incentives for home buyers, subsidies, or regulations can impact house prices.
- Speculative Investments: In areas where housing is seen as a lucrative investment, speculative buying can drive up prices.
- Population Growth and Urbanization: Areas experiencing rapid population growth or urbanization can see increased demand for housing.
- Development Costs: Increases in construction costs, land prices, or regulatory costs can push up new home prices.
- External Events: Natural disasters, global economic downturns, or pandemics can affect the housing market.
To find the current housing inflation rate for a specific area:
- Official Statistics: National statistical offices or housing agencies often publish data on housing prices and their annual changes.
- Real Estate Indices: Indices like the Case-Shiller Home Price Index in the U.S. track home price changes and can provide insights into housing inflation.
- International Organizations: The OECD, World Bank, and IMF sometimes provide data and reports on housing markets globally.
- Real Estate Associations: National or regional real estate associations often have updated data on house prices and their appreciation.
It’s essential to interpret housing inflation rates with caution. High rates might indicate a booming market, but they can also signal a housing bubble. Conversely, negative rates might indicate a market downturn or a more affordable housing market. Always consider the broader economic and local context when evaluating these rates.
House Price Index by Postcode
A House Price Index (HPI) by postcode provides a granular look at property price movements within specific postal code areas. Such an index can offer insights into local housing market trends, giving potential buyers, sellers, investors, and real estate professionals a more localized understanding of property values.
To create a House Price Index by postcode:
- Data Collection:
- Collect sale prices of properties within each postcode for a defined period (e.g., monthly, quarterly, annually).
- Ensure data consistency by excluding outlier transactions like sales between family members, foreclosures, or non-arms length transactions.
- Baseline Establishment:
- Choose a baseline year or period. The average house price during this period in each postcode will serve as the reference point, typically set to 100 in the index.
- Calculation:
- For each subsequent period, calculate the average house price for each postcode.
- Compare this average to the baseline period to derive an index value. For example, if a postcode’s baseline average house price was $200,000 and the current average is $220,000, the index value for the current period would be 110 (reflecting a 10% increase).
- Normalization and Seasonal Adjustments:
- Depending on the region and dataset’s comprehensiveness, you might need to make adjustments to account for seasonality in housing sales or other periodic factors.
- Publication and Updates:
- Regularly update and publish the index to reflect new transaction data.
- Provide accompanying analyses or insights to help users understand any significant movements or trends.
- Digital Tool Creation (for enhanced user experience):
- Develop a web-based tool where users can input a postcode and view the HPI history for that area.
- Consider visual aids like graphs or heat maps to display trends or compare multiple postcodes.
For real-world examples:
- In the UK, the Land Registry’s UK House Price Index provides data at a regional level, and there are various services and platforms which might further break this down by postcode.
- In other countries, national or regional housing agencies, real estate associations, or private real estate data firms might offer similar localized indices or datasets.
If you’re looking for an HPI by postcode for a specific region or country, you might need to refer to local real estate databases, governmental housing agencies, or private real estate analytics firms that specialize in that region.
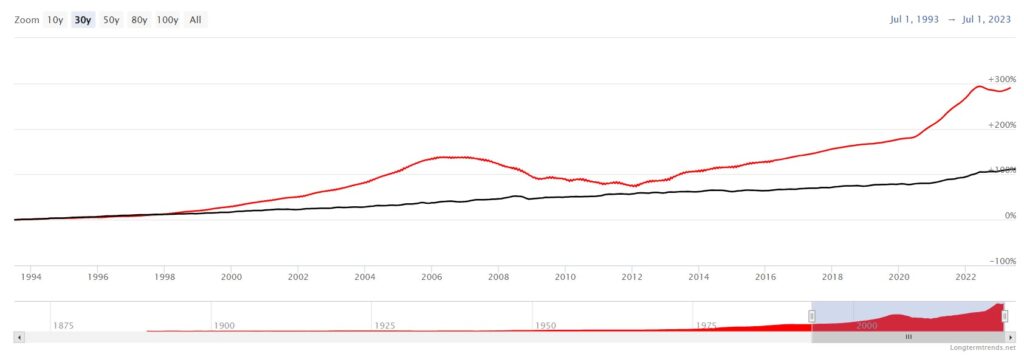
Inflation-adjusted Housing Prices Chart (USA)
Inflation-adjusted Housing Prices Chart (UK)

Frequently Asked Question
1. What is a House Inflation Calculator?
A House Inflation Calculator provides users with an estimate of how much a house’s value has changed over a specific period due to inflation and other market factors. It helps homeowners, potential buyers, and investors gauge the real value and appreciation of a property.
2. How is the house inflation rate determined?
The house inflation rate is typically based on national or regional house price indices, reflecting the annual percentage change in house prices. Various factors, including supply and demand dynamics, interest rates, and economic conditions, can influence this rate.
3. Why is the value given by the calculator only an estimate?
While the calculator uses historical inflation rates and data to provide a result, individual property values can vary based on location, condition, local market trends, renovations, and other factors not accounted for in the calculator.
4. How often is the calculator updated?
The frequency of updates depends on the data source. If the calculator relies on national or regional housing indices, it would typically be updated monthly, quarterly, or annually, based on the release schedule of the data.
5. Can I use the calculator to predict future house values?
While the calculator provides insights based on past inflation rates, predicting future house values requires consideration of various unpredictable factors, making any estimate speculative.
6. Does the calculator account for regional variations in house inflation?
Unless specified, a general house inflation calculator might use national averages. For more accurate regional results, ensure you’re using a calculator tailored to a specific region or country.
7. Why might my house’s actual value differ from the calculator’s estimate?
Numerous factors, like property renovations, local market crashes, or specific events (like new infrastructure projects nearby), can greatly affect home value. The calculator provides a broad estimate based on general inflation trends.
8. How does house inflation differ from general inflation?
House inflation specifically relates to the change in house prices over time. In contrast, general inflation refers to the overall increase in prices and fall in purchasing value of money in an economy, encompassing a wide range of goods and services.
9. Why is understanding house inflation important?
Understanding house inflation helps in making informed decisions about buying or selling property, evaluating investment performance, and understanding the real purchasing power of money in the housing market.
10. How can I get more localized or specific housing data?
For more detailed or localized insights, consider consulting local real estate agencies, accessing regional housing databases, or using specialized online platforms that cater to specific regions or property types.